Fig. 23. §1 Studio
3D Data
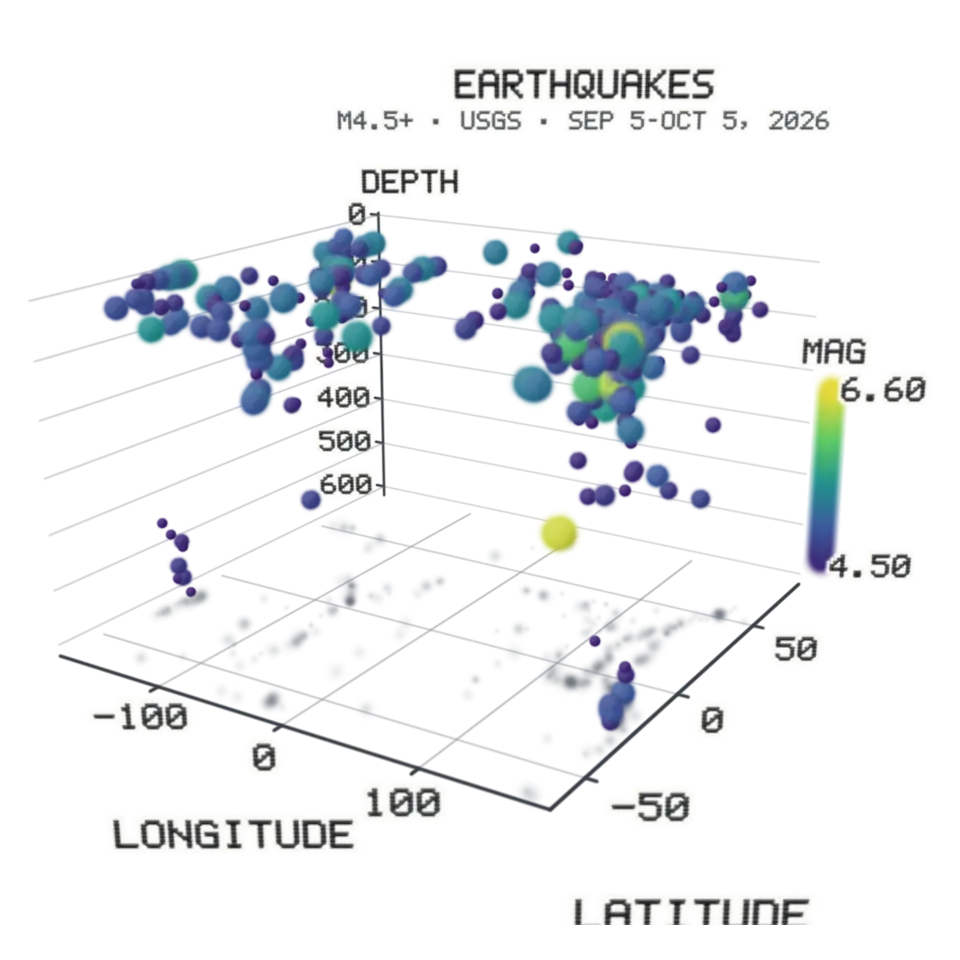
A table becomes a 3D chart you can turn: each row a point in a scatter, or rows gathered into bars or a surface whose heights are the mean of the rows in each cell.
1Facts
- Shelf
- Studio
- Kind
- Built from a recipe
- Your own
- Your table
- Sound
- Yes
- Licenses
- Public domain, CC BY 4.0, MIT
2How to play
Open a CSV or TSV in the Splash tab, pick the columns for X, Y, Z and color, and tap anywhere on the chart.
3Its controls
Table I. Every control on this Splash.
| Control | Kind | Range | Start |
|---|---|---|---|
| Drop and rise | Tap | ||
| Drop and rise | Button |
4About it
A table becomes a 3D chart you can turn: each row a point in a scatter, or rows gathered into bars or a surface whose heights are the mean of the rows in each cell. The labels turn to face you as you go round.
Your file is read in your browser and never uploaded. Headers, quoted fields, dates, categories and missing cells are understood; a very big table is shown as an even random sample, and the Splash tab says so. Save a picture or a turning video from the Splash tab. The samples are a month of earthquakes (USGS), Fisher's 150 iris flowers (UCI, CC BY 4.0) and the CO2 record at Mauna Loa (NOAA).
5Details
- Your own files
- .csv, .tsv, .tab, .txt, text/csv, text/tab-separated-values, text/plain
6Sources and credits
| Work | By | License |
|---|---|---|
| Earthquakes of magnitude 4.5 and up, past 30 days (snapshot of October 5, 2026) | U.S. Geological Survey | Public domain (U.S. government work) |
| Iris (Fisher, 1936) | R. A. Fisher; UCI Machine Learning Repository | CC BY 4.0 |
| Mauna Loa monthly mean CO2, May 1974 to August 2026 (snapshot of October 5, 2026) | NOAA Global Monitoring Laboratory | Public domain (U.S. government work) |
7Libraries
- MIT
- gifenc 1.0.3